Figure 3.2.1 Simulation of the pseudo-nmos 5-input AND gate. Top curve shows output. Bottom curve shows input. Back to 2.0 METHODS
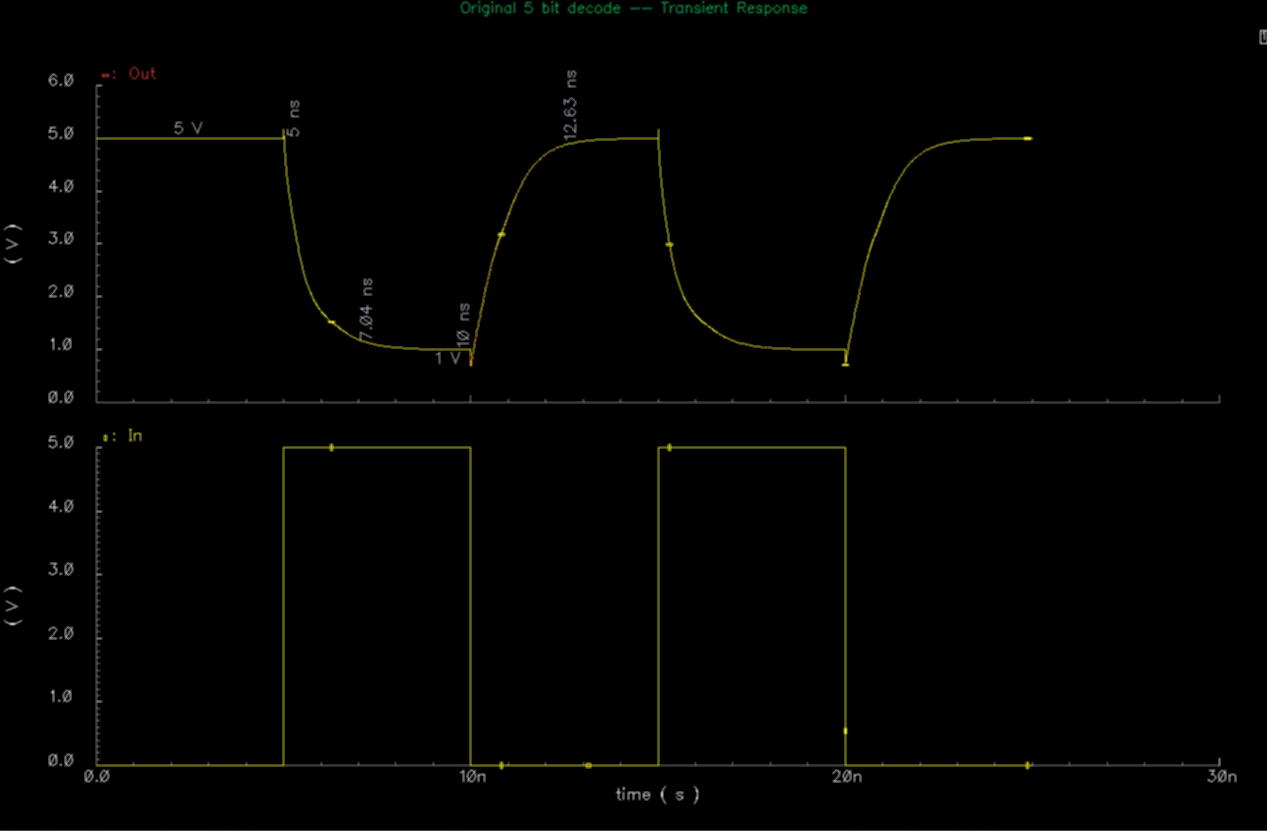
Figure 3.2.1 Simulation of the pseudo-nmos 5-input AND gate. Top curve shows output. Bottom curve shows input.
Back to 2.0 METHODS